Reading a Display for Advent of Code 2022 – Day 10
- Date
Day 10 of Advent of Code had us determine which pixels should be enabled on a broken display. These pixels make a string that is the final input. Some times challenges like this can be interesting to look at, because the puzzle has the display go through a series of iterations before the string comes to form. This puzzle was much more straight forward.
Lessons Learned
My renderer never had a means to update the perspective matrix, leaving me stuck with a near / far ratio of 0.01 to 1000 and a field of view of 60º. I added updatePerspective to allow modification of these values at any time.
I noticed in my previous visualization that memory usage was extremely high. I didn’t think too much of this
until this visualization also consumed a lot of memory for no real reason. This is a simple render comparatively. The
last time this happened, I was bitten by CVMetalTextureCache taking a reference to the output texture as a parameter:
CVMetalTextureCacheCreateTextureFromImage(
    kCFAllocatorDefault,
    textureCache,
    pixelBuffer,
    nil,
    .bgra8Unorm,
    CVPixelBufferGetWidth(pixelBuffer),
    CVPixelBufferGetHeight(pixelBuffer),
    0,
    &tMetalTexture
)
In the above code, the function takes a reference to currentMetalTexture as output. This would cause Swift to never
release any previous value in currentMetalTexture, effectively leaking every texture made. Assigning nil to
currentMetalTexture was the fix in that case.
But this was not the issue. It felt like another texture leak, because the size was growing quickly with every frame. A look at the memory graph debug should 100,000+ allocations in Metal, so I was on the right track.
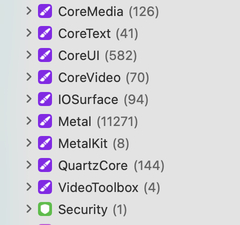
Most of the objects still in memory are piles of descriptors and other bookkeeping objects, but they were all stuck
inside of autorelease pools. Since the rendering function is just one long async function, anything created inside of an
autorelease pool in the function will never get released until the function eventually ends. Wrapping the function in an
autoreleasepool closure solved the issue and brought memory consumption on both this visualization and the previous
one under control.